Tidbits from the Census results

Last Thursday’s news bulletins were filled out with items about some of the figures in the Census results release — age statistics, numbers of indigenous people, and economic indicators — but there were a few other gems in there too.
Contrary to everyone’s fears about the Asian rabble overrunning the country, Italian is the most common non-English language spoken at home in WA, SA, and Victoria. But WA has a much lower proportion of people speaking Arabic at home (0.4%) than NSW (2.5%), where it’s the number two language. In the not-so-multicultural south, non-English languages can be heard in the homes of only 8% of Tasmanians. (The other extreme is 34% in the Territory, where Aboriginal languages dominate.)
Unsurprisingly, WA has a higher-than-average proportion of people living in detached houses (at 79%, the stuff of urban sprawl), but despite the complaints about rental property shortages our median weekly rent ($170) is well below that of Queensland ($200) and the ACT ($260).
WA does have the lowest proportion of people born in Australia, 65%, but the number two country of birth in every State and Territory is England (with New Zealand, Italy, and China also making strong showings). Curiously, our proportion of people with “no religion”, 22.9%, is higher than the national figure of 18.7% and the NSW figure of 14.3%.
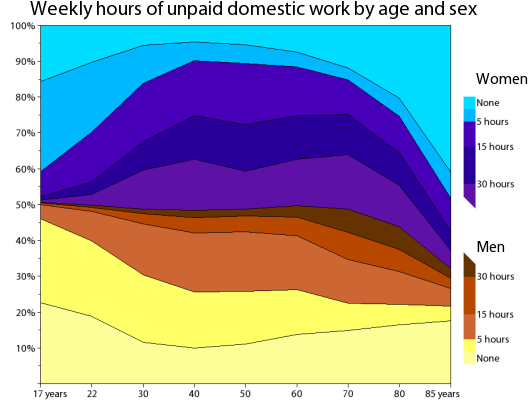
In the world of family, Tasmania and SA host a slightly higher occurrence (40%) of couples living with no children than the national average (37%). And as the graph shows — vertical segments being the proportions of people that age ticking each box for “how much housework did you do this week?” — the people who report doing the most at home are all female and mostly middle-aged. (My spreadsheet for this is here.)


You’ve been tagged
Oh come on, everyone can see past your thinly veiled plea for sympathy but I’ve got some news for you… Blogging doesn’t count as “unpaid domestic work”
Also, surely the median rent in Perth has risen from $170 p/w since the census. And I don’t know about Queensland but can you really compare the Canberra rental market with Perth’s? I don’t think there is quite the ‘range’ of rental accommodation in Canberra as here (ie significant amount of fairly high earning public servants and considerably fewer bogan tenants) .
Hrm, you’re right. I think I’ll slap on some Google ads so it stops being unpaid!
Fair point about the ACT — it is famous for its tight rental market and the census confirms it’s the most expensive. I’m not sure that invalidates the comparison though, since in turn Sydney has a much wider range of rental options than Perth.
I confess to not having dug into the housing data deeply enough to make a more accurate assessment …
I’ve just come back to your blog because I’ve been forgetting to get my dose of issues and politics and stuff. Also because my other computer died with all my RSS feeds.
Anyway, when I came back it seems your link to your RSS feeds at that bottom of your main page are a bit wrong – they’re coming up as feed://http//hourann.com/feed or something like that. Reckon you could fix that up?
It’s a WordPress-ism … a proposed standard that never took off, or something.
Temporary fix implemented, with a permanent one forthcoming! (Maybe.)